Introduction
Time Series Analysis is a powerful statistical technique that involves studying and interpreting data points collected over time. It plays a crucial role in various fields, providing valuable insights into patterns, trends, and behaviors inherent in temporal data. This article explores the importance, applications, and steps involved in Time Series Analysis.
Purpose
The purpose of this project is to know the production trends of cacao in a particular region in the Philippines. This was part of my class requirement for a doctoral study in Sustainable Development.
Objectives
To identify which province has high cacao production over time.
To determine which year has the highest production of cacao.
Steps
- Visit agricultural data statistics such as Openstats.
- Download the data in Excel on Cacao production on quarterly basis.
- Data cleaning. This follows several steps from arranging the data to suit for time series analysis. Converting “quarterly” label to “datetime” format. Clean and handle missing data, smooth out irregularities, and transform data if necessary (e.g., log transformations).
- Model Selection: Choose an appropriate time series model based on the characteristics of the data, such as autoregressive integrated moving average (ARIMA), seasonal decomposition of time series (STL), or machine learning models.
- Model Training: Split the data into training and testing sets, train the chosen model on the training data, and validate its performance on the testing set.
- Forecasting: Use the trained model to make predictions about future data points, providing insights into future trends.
- Evaluation: Assess the accuracy of the model by comparing its predictions to the actual values, using metrics like Mean Absolute Error (MAE) or Root Mean Squared Error (RMSE).
Tools
- Python -Statsmodels library, matplotlib, and Pandas
- Jupyter notebook.
- Excel
Results
The image below shows the code to run a time series analysis.

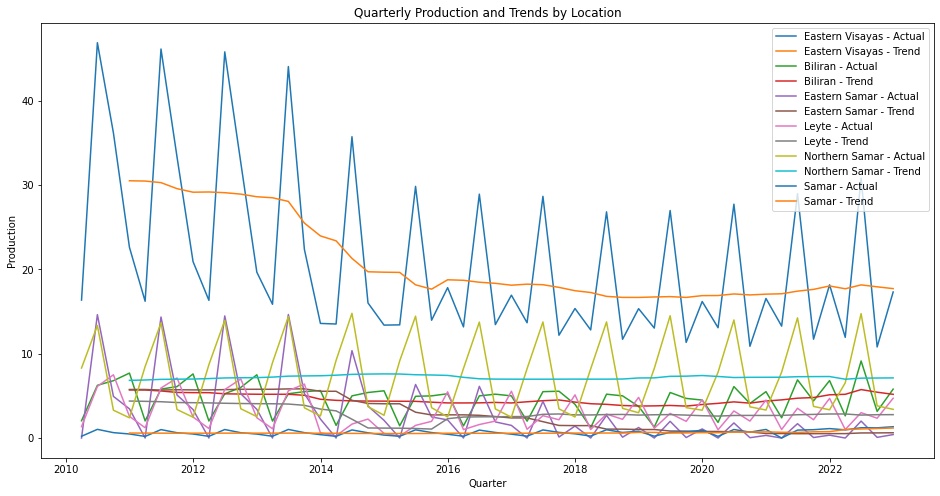
Results of time series analysis with rolling plot (Arima model). It shows that the cacao production is decreasing in this example.
Conclusion
Time series analysis can be used in any field of interest. In this project, time series analysis is used to predict the trend of cacao production in Region 8 Philippines.
By leveraging the insights derived from temporal data, organizations can make informed decisions, mitigate risks, and optimize their operations for sustained success.