Introduction
A climate resiliency index is created to address issues on how resilient a city on disaster and related events.
Due to its complicated factors of resiliency and broader definitions, the project tried to accomplish a composite index based on a locally available data.
Fortunately, I was able to take part of an Open Data Hackathon hosted by DOST-SPARTA. A Philippine-based agency that advocates data science.
So, this was my study all about.
Purpose
The basic premise of this project is to know whether a place is climate resilient based on the locally available census data.
There are many resiliency definitions in the scholarly literature however, one author puts said that climate resiliency should be localized. This means that the definition should be applicable in the local setting.
Objectives
- To create a climate resiliency index based on census data.
- To determine what are the factors that affect the resiliency of household residents
- To create climate resiliency indices.
Tools
The tools I used in the project are the following:
- JAMOVI
- QGIS
- Python
- Excel
- Tableau Public
Steps
1. Collect the sociodemographic data of a city under study.
I had a chance to use the Cauayan CBMS data because I joined the Open Data Hackathon for Sparta, which I got second prize during the event.

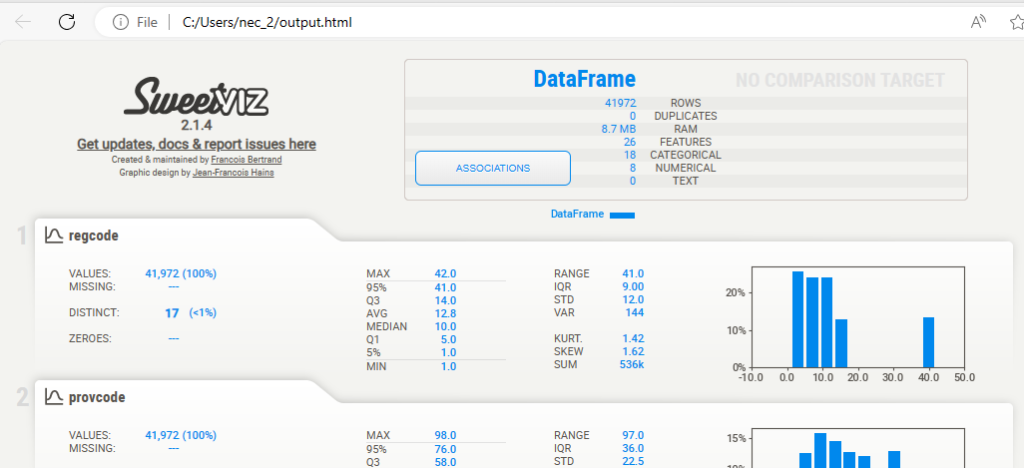
2. Perform Exploratory Data Analysis
I used a python library Sweetviz to easily visualize the data without need to use other libraries for visualization.
EDA was performed to discover data distribution, correlation, and association of variables before proceeding to further analysis.
3. Confirmatory Factor Analysis
At this stage, I used JAMOVI for the CFA. Conceptually, I have for factors (exogenous variables) in the study. These are important in the later part of the analysis.
- Exposure to Risk
- Access to Utilities
- Economic Activities
- Social Capital
4. Sensitivity Analysis Using Monte Carlo Simulation
Due to the small number of sample size (e.g. number of villages in the city) which is an issue of statistically reliability. Monte Carlo simulation was performed making the climate resiliency model fit. MS Excel add in was used in this simulation.
5. Normalization of Climate resiliency Index
In order to have a comparable result with all villages, data were normalized having only a value of 0 to 1 with zero being least and 1 being high resiliency.
6. Index validation
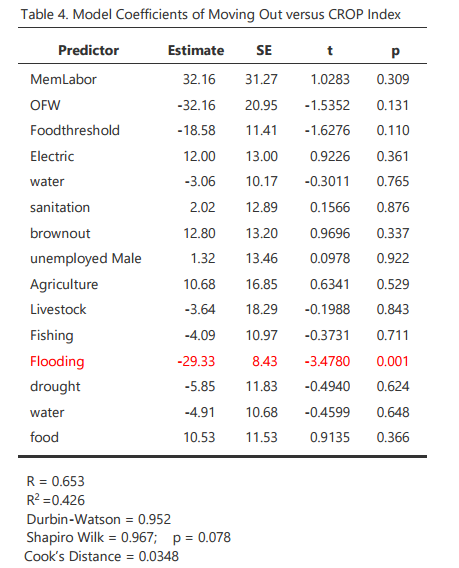
At this point, the indices where validated using multiple linear regression and pearson correlation in JAMOVI.
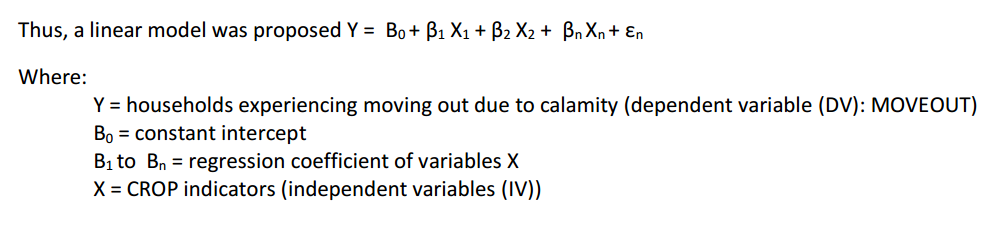
Theoretically, moving out (households moved out because of flood) is affected by social, economic, utilities, exposure to risk, or compositely called CROP index model.
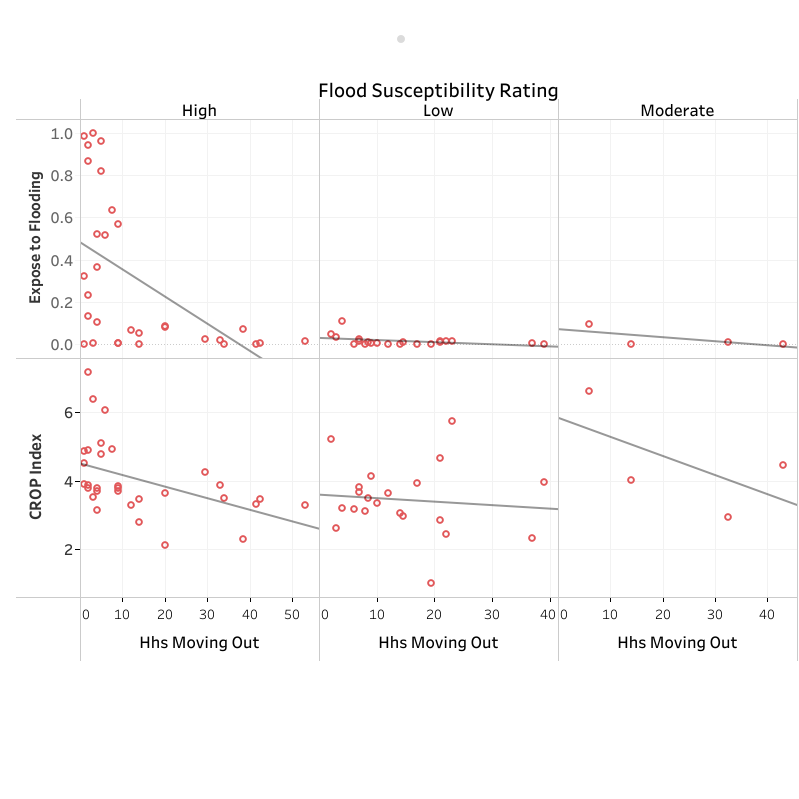
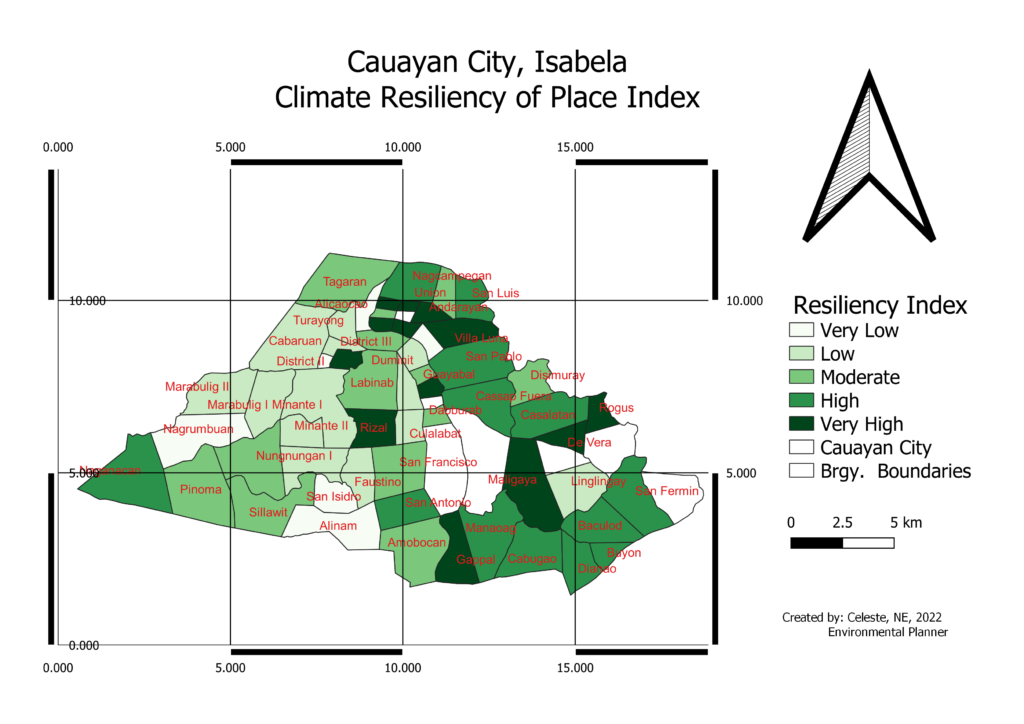
Results
Based on the climate resiliency model, it appears that moving out is determined by the flood susceptibility, particularly on exposure to risk of flooding.
Results of the climate resiliency index where visualized using QGIS to exactly determine its location of specific places.
Watch the whole video here.
Conclusion
Climate resiliency of Place (CROP Index) is very important in order to allocate resources in disaster risk response and climate change mitigation and adaptation.
This project is an example of how a city can point out highly critical areas and respond to it.
Decision makers can make use of a data-driven policy about disaster using just their socioeconomic profile available locally.
Reference
Celeste, Novlloyd, Fight or Flight: Exploring Climate Resiliency of Place (Crop) in Disaster Risk Areas. Available at SSRN: https://ssrn.com/abstract=4591267 or http://dx.doi.org/10.2139/ssrn.4591267
